
Six hundred hours of unplanned downtime. Year after year.
An average corrugated cardboard plant loses about 10 percent of its scheduled production time due to unplanned downtime. With 6,000 operating hours, that amounts to 600 hours per year. A large portion of this is due to cleaning, which is recorded under various categories such as malfunctions, changeovers, and maintenance.
* Total Productive Maintenance
Calculation Example
600 hours × €2,500 production value = €1.5 million per year
10%
of the planned production time is lost to unplanned downtime
±600 hours
lost production per year based on 6,000 operating hours
26
Recurring bottlenecks identified in benchmarks at flexographic and corrugated cardboard plants
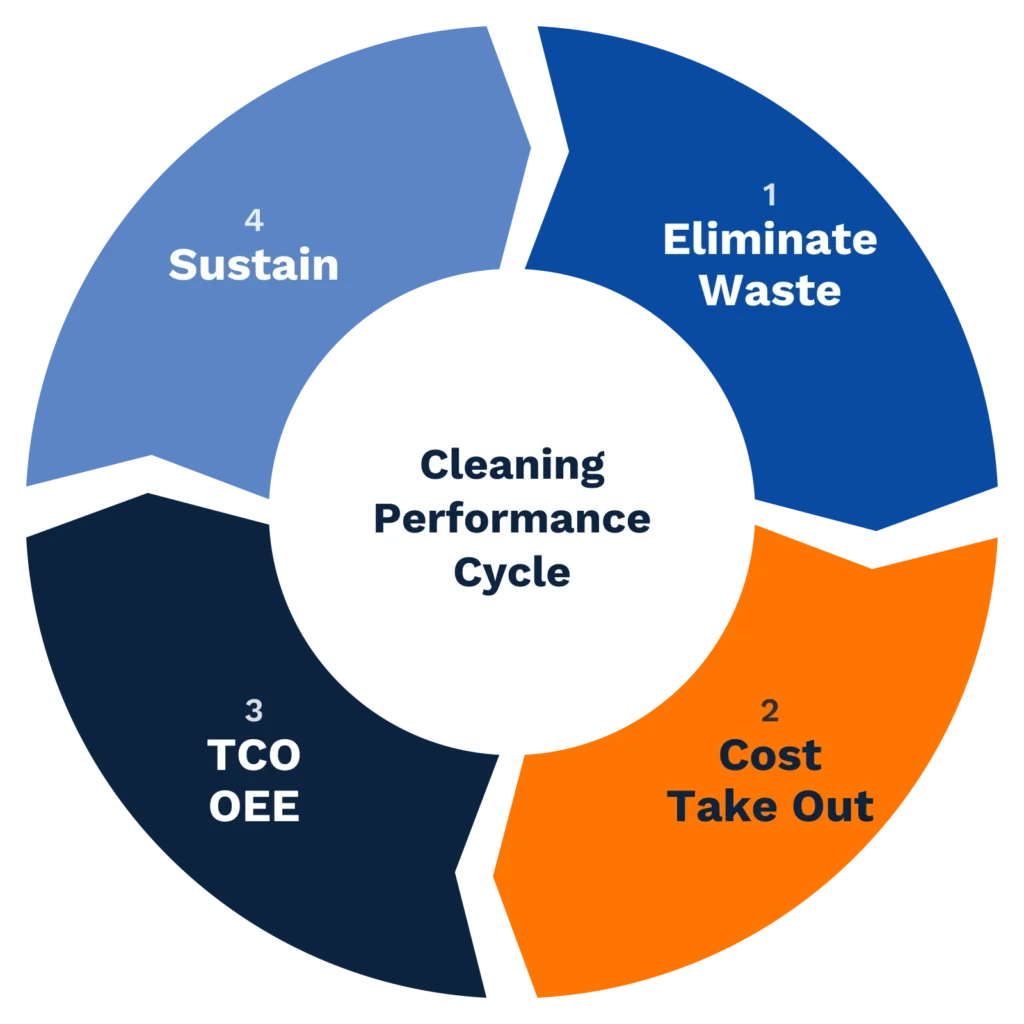
The Cleaning Performance Cycle
Four root causes, ten forms of waste, and 26 critical junctures. The cycle reveals where time, quality, and capacity are lost, and recovers those losses step by step.
Step 1
Eliminate Waste
Step 2
Cost Takeout
Step 3
TCO and OEE
Step 4
Sustain
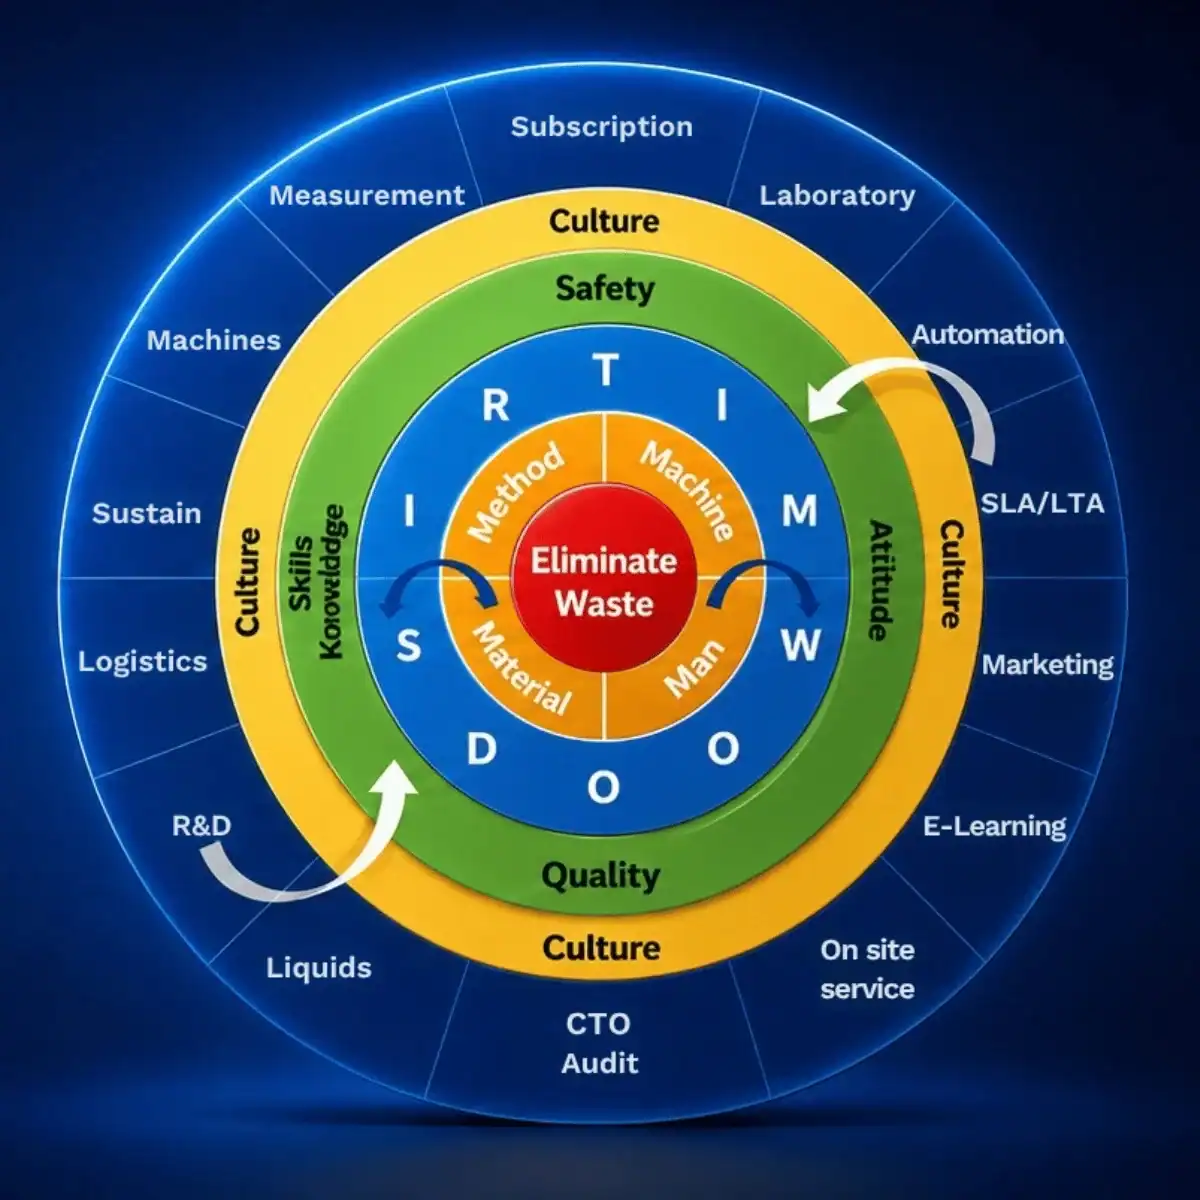
Click on the wheel to enlarge it.
The Orange Ring: The 4 M's
Machine
Technical condition, settings, availability, and maintenance.
Method
Procedures, cleaning frequencies, work arrangements, and process design.
Human
Knowledge, training, communication, and implementation.
Materials
Inks, cleaning agents, substrates, and other materials.
The Light Blue Ring: SIR TIM WOOD
Ten forms of waste, ranging from transportation and inventory to rework and underutilized skills. Where a cause and a form of waste intersect lies the greatest opportunity to reduce losses in a targeted manner.
Find out what bottlenecks exist in your plant
The matrix links the 4 M’s to the ten forms of waste. Click on an orange plus sign for a detailed practical example, or on a green dot to see what that bottleneck might mean for your plant.
Click on an orange plus sign to see a fully worked-out example. Click on a green dot to see what that bottleneck might mean for your plant.
Machine and Wait Time
Example from one benchmark plant. This amount stands alone and is not included in the other examples.
Shutdown due to severe contamination.
Production stoppages, missed output targets in your KPIs, and a direct blow to operator morale.
The right cleaning solutions, a suitable cleaning machine, on-site cleaning service, automation, training, and e-learning.
A structured cleaning routine increases productivity and motivation.
Materials and Wait Time
Example from one benchmark plant. This amount stands alone and is not included in the other examples.
Cleaning is not included in the production schedule.
Unscheduled cleaning is postponed, then canceled or rescheduled for the next shift. This results in unplanned downtime.
Implement a regular cleaning routine, supported by a subscription model and operator training.
Greater control, fewer unplanned downtimes, higher OEE, and clear ownership of quality.
Method and Defects
Example from one benchmark plant. This amount stands alone and is not included in the other examples.
Material defects.
Chemical incompatibility with production materials.
Support from CSG’s R&D team and laboratory, including advice on the appropriate cleaning agent.
Tailored advice leads to better process control and a more cost-effective implementation.
People and Defects
Example from one benchmark plant. This amount stands alone and is not included in the other examples.
Human error.
Incorrect execution of tasks slows down the process and causes unplanned downtime.
On-the-job coaching, plus training on the importance of cleaning.
Fewer errors, less downtime, fewer safety risks, greater confidence, and better results.
Does this sound familiar?
Find out how much this costs you each year and where the other 25 bottlenecks in your organization are located. During a Cost Take-Out Audit, we map out your cleaning process and quantify each loss in monetary terms.
Request a consultation with an expert →The amounts in the examples come from different plants and should not be added together: bottlenecks often share the same cause.
Two regular routines. Deep cleansing less often.
Daily and periodic cleaning together make up your preventive maintenance routine. If you perform both consistently, print quality and machine performance will remain stable for longer, and you’ll be able to postpone costly deep cleaning for as long as possible.
Every day
Give it a quick cleaning after each run to prevent dirt from building up.
Periodically
Weekly or monthly, focusing on cell volume and ink transfer.
Deep
Planned and controlled, and—thanks to a set routine—needed as rarely as possible.
WITH A SET ROUTINE
1 scheduled deep cleaning every year and a half
WITHOUT A SET ROUTINE
4 deep cleanings per year, plus unpredictable downtime

Why a globally operating corrugated cardboard factory has actually started cleaning more often
Deep cleaning was removed from the weekly schedule. Operators now know when to do what—and why.
From an exploratory meeting to an improvement plan
Introductory Meeting
An overview of your production process, cleaning routine, and key challenges. Free of charge.
Cost Take-Out Audit
If there is sufficient potential for improvement, the audit provides a comprehensive overview of cleaning procedures, downtime, and work methods.
Concrete Improvement Plan
Routines, resources, priorities, and the expected savings potential, all in one practical plan.